Loading
All Guides
BLOCKCIRCLE/GUIDE/AMS/LAST UPDATED FEBRUARY 2026
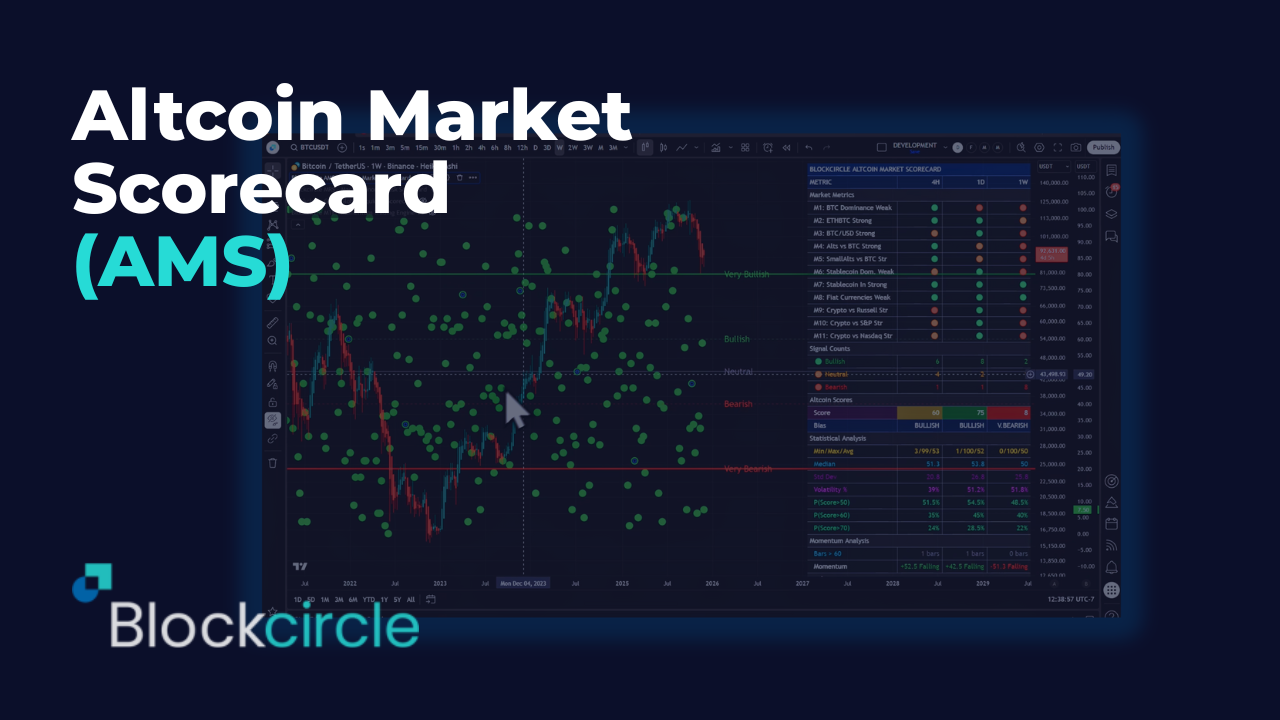
Altcoin Market Scorecard (AMS) - User Guide
02 — MANUAL
Step by step.
READ TIME 10-15 MIN
03 — OPEN
Open the product.
ONE CLICK
TrustPilot
4.9 / 5 · 69 reviews
"Member since 2018. The real value is in the Discord and the market data. Basel and Hunter provide a perfect blend of expertise."
L
Lloyd Brown
Dec 2024
"Best subscription I've ever had. High ROI. Phenomenal community. Founders are top 1% in vision and innovation."
A
Al Arqam
Dec 2024
"No team better than Blockcircle. The alpha you get here you cannot find anywhere else."
C
Crypto Natix
Dec 2024
"Basel and Hunter are godsends for anyone trying to navigate the crypto space."
J
Jeff F
Dec 2024
"Best crypto group. I can't believe the guys who run this are so transparent and helpful."
R
Ronniecryptonic
Dec 2024